Introduction
The World Health Organization defines urgency as an unexpected occurrence, in any place or activity, of a problem of diverse cause and variable severity that generates awareness of an imminent need for attention by the person suffering from it. Large, primarily private, highly specialized hospitals (HSHs) have been considered those that have so-called reference services in cardiac surgery, thoracic surgery, and neurosurgery1. Future trends regarding HSHs that should be considered when conducting a strategic reflection on these types of organizations include: New technological advancements, which affect diagnostic instruments, with a general trend toward more information obtained from less aggressive techniques and treatment. An increase in outpatient activity1. A study of emergency admissions in England found that more than a quarter of admissions did not require an overnight stay2. This implies that many emergency patients could benefit from ambulatory emergency care by having a systematic approach to process redesign. This involves immediate access to urgent care that would normally require the resources and expertise available in a hospital3. In Europe, the Dutch ensure the quality of medical care through the support provided to health centers by the CBO (National Organization for Quality Assurance in Hospitals), which is responsible for establishing, supervising, and evaluating activities with quality assurance in health care sectors. Another mechanism is the creation of a certification system4. A countless number of organizations express difficulties with execution strategy, lack of structure, and transparency in strategic management to achieve a structured description of the organization5. In practice, care models are not user-centered; they focus on disease recovery and increased technology consumption, and the need to drive change processes, with an emphasis on generating institutional conditions to integrate care processes6 as unique and distinctive value chains7, capable of efficiently sustaining quality care processes and patient safety, aligned with global policies. The process is redesigned through the analysis of each activity, identifying priority activities and analyzing categorization and value to the customer and the organization8.
Thus, we can see that interesting proposals have been achieved, and although isolated solutions exist, the problem persists of a lack of detailed analysis in the processes of activities in HSHs to identify activities for waste elimination and cost minimization, and thus, the prioritization of indicators for improvement in the comprehensive process architecture (PA).
Material and methods
The conceptual and operational definition of variables are shown in table 1. This study aims to model redesigned PA and medical indicators for the analysis of emergency department (ED) activities through strategic alignment and process diagnosis to fulfill its objectives within the framework of health sector management and enhancing the quality and transparency of health research initiative guidelines. We conducted a descriptive research across 3 HSH through interviews with medical staff, nurses, emergency specialists, ED heads, and medical directors. The validation instrument consisted of cross-functional maps at levels 2 and 3, with content validity by medical management experts and emergency specialists from 3 HSHs in Mexico City (Mexico). The chosen option was on-site interviews, ideal for modeling the process, which involves visiting work areas and interviewing various stakeholders from the beginning to the end of the process. Once their list of activities was requested and completed, at least the following questions were asked9: (1) What is the objective of your area? (2) What do you do on a daily basis? (3) How do you do it? (4) Who depends on you? (5) How is your work team integrated? (6) Who do you interact with outside your work area? (7) What initiates your activities or with what document or instruction do your daily work activities begin? and (8) Who performs the activity, and then or immediately who performs the next activity? This continued until the sub-process or stage was completed. For mapping and to evaluate activities, key performance indicator (KPI) variables were established and defined to relate their priority level and behavior in the construction of the PA and validate the redesign and improvement of the definitive cross-functional maps of the medical service.
Table 1. Conceptual and operational definition of variables
| Objective and strategy | Quantitative variables | Conceptual and theoretical definition | Operationalization of variables | Instrument and information source |
|---|---|---|---|---|
| To model redesigned process architecture and medical indicators for the analysis of ED activities through process diagnosis at Level 2 and strategic alignment to meet objectives within the framework of health sector management. | Independent variables: indicators in priority activities in the redesigned mapping of the Emergency Medical Service, converging or interdependent with KPIs that collectively affect dependent variables or outcomes in patient quality and safety in HSH services and care. | Develop cross-functional and interdisciplinary mapping for analysis and KPI measurement for emergencies. | Level of association and influence of indicators on the quality of emergency and high-specialty hospital care. | Analysis and validation of architecture in mappings with interviews of medical and support personnel or the actors in the emergency process, and Health Information System (HIS) or Hospital Information System (HIS) reports in Emergency. |
|
ED: emergency department; HSH: highly specialized hospital; KPI: key performance indicator, HIS: health information system. |
||||
A cross-functional vision, supported by processes, allows for integrating efforts around a common goal10. Process evaluation is an instrument for achieving the mission and vision that allows for continuous improvement. Performance indicators, on one hand, serve to indicate and mean to show something, with clues and signals. On the other hand, performance is the ability to manage resources and fulfill established objectives and goals. In performance measurement, there are 2 priority aspects: the first is to measure efficiency, and the second is to measure effectiveness. The first is defined as the benefit-to-cost ratio; and the second is what is performed or executed in relation to what is planned within the established time11. Hypothesis H1 states: Activities where waste is eliminated and activities are improved are identified using cross-functional mapping. Hypothesis H2 states: Cross-functional mapping allows for placing KPIs (also known as KPIs, for their acronym in English) in priority activities in high-specialty hospital care services.
Diagnosis for process improvement and redesign
There are various criteria for activity analysis. In economics, the concept of the ABC cost model allows for the allocation and distribution of different indirect costs, according to the activities performed for the production of a product or service. Since activities have a direct relationship with products, the activity-based costing system transforms indirect costs related to products into direct costs related to activities, leading to a more effective way of transforming the cost of factors into the cost of products and services12.
In this stage of the PA at level 2 (Fig. 1), the concrete interpretation of what happens within the sub-process is carried out, disaggregating it into stages for analysis in cross-functional maps. To achieve this, it is proposed to initiate and classify the activities of the interdisciplinary process map. Internally to the process per se, 3 stages will be reviewed for analysis:
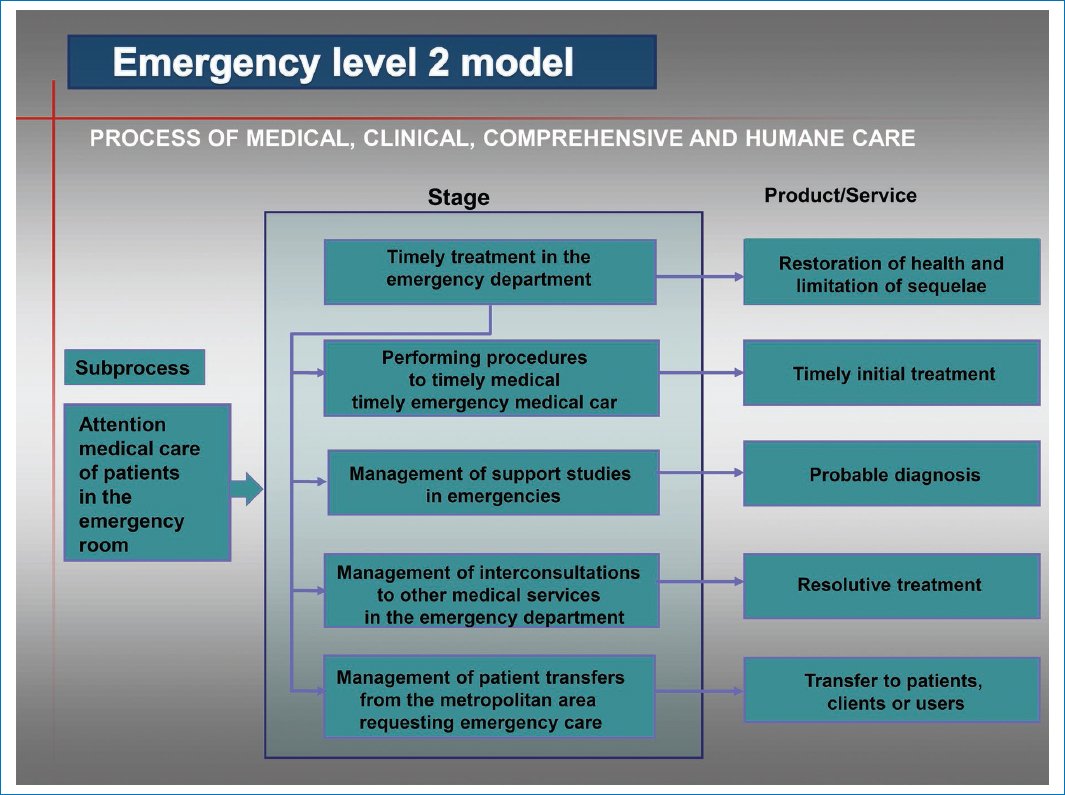
Figure 1. Level 2 emergency department model. The disaggregation of processes into subprocesses is called Level 2 map. This means that these subprocesses are further broken down into stages, and the medical care product or service provided to the client, user, or interested party in the ED is also determined.
STAGES THAT ADD OR CREATE PERCEIVED VALUE
Working for the customer, user, or stakeholder (Class A). A useful criterion worth focusing on is the analysis that develops a perceived service quality behavior process model13. Perceptions of quality dimensions (accessibility, differentiation, quality, exclusivity, and specialization) of service are considered a function of the customer’s prior expectations of what will happen and what should be during a service encounter, as well as the customer’s most recent contact with the service or product delivery system. That is, perceived value is the overall judgment made by the customer, user, or stakeholder about the usefulness of a product or service, based on perceptions of what is given and what is received. Thus, the customer, user, or stakeholder considers perceived value and price. Where perceived value by customers is key to the success of the production of the good or service. Therefore, each of the activities on the process map must be reviewed, and from this criterion, it is possible to identify, with the stakeholders and owners, which of their activities are Class A and mark each one on the process map to be improved or redesigned.
STAGES THAT DO NOT ADD VALUE
Working for ourselves (Class B). The Class B stages in this methodology of the PA indicator model correspond to those activities that are inherent to the administrative management of the process and must be performed until they are automated; in the short term, they will tend to disappear and become Class A activities. For example, official requests, reports, and so on. And, of course, they must be indicated in the mapping of the analyzed process.
WASTE STAGES
Working for nothing (Class C). This involves identifying waste or parasitic activities (which are not useful for the client, user, or stakeholder, nor for the organization) in the processes, but first, general knowledge about their definition and classification is provided (Fig. 2).
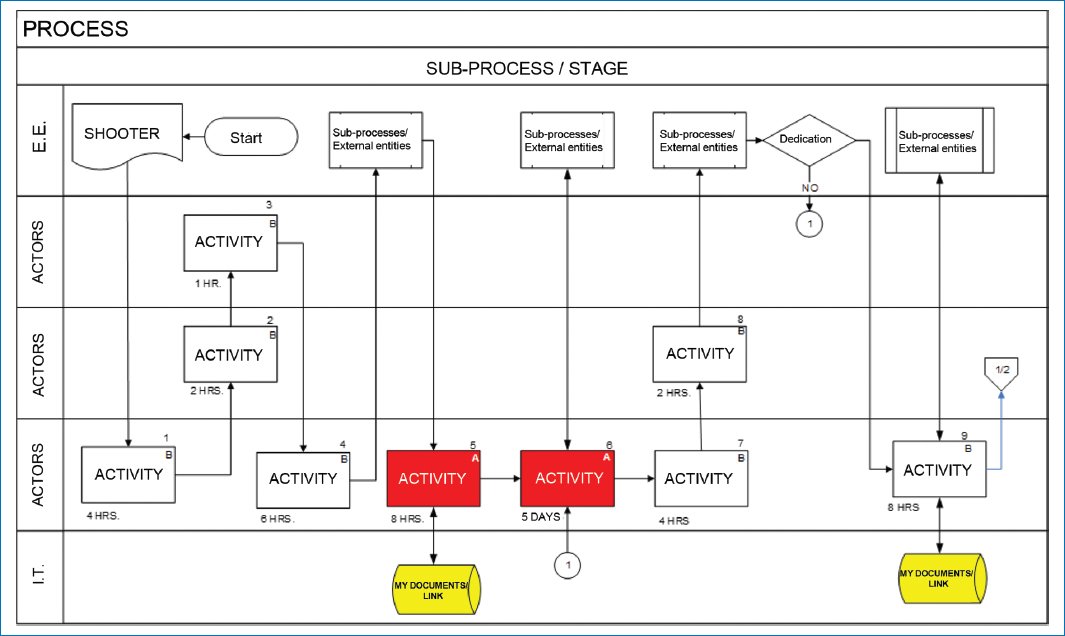
Figure 2. Class A, B, C Activity Diagnosis Map. This figure illustrates that the process, subprocess, or stage must be named and begins with a trigger (which can be a request or requirement for the creation of a medical product or service). All numbered activities performed by the various process actors are then unleashed, categorized as A, B, or C. In addition, part of the process automation performed through personal computer redirection is visualized. Activities marked in red are priority activities (of greater relevance), and these are where indicators, key performance indicators, or metrics will be established to guarantee the creation and delivery of a product or service in a timely and appropriate manner upon completion of the subprocess or process. External entities that connect to and contribute to the process through various regulations or value can also be observed. Source: Adapted from Microsoft Visio15.
Waste, byproducts, residues
Two types of inefficiencies are categorized: productive, which is waste in excessive costs of a product, and allocative, which delivers the wrong product. Waste can be categorized into 3 types: administrative waste (expenses exceeding what is necessary to achieve objectives), operational (the production of inefficient activities for medical care), and clinical waste (allocative waste that has no value to the patient).
Inefficiencies persist within the health care system because, compared to other economic sectors where competition and other incentives act to reduce the level of waste, none of the actors in the health care process have sufficient incentives to economize. Waste is caused by factors, such as health insurance and medical uncertainties that encourage the production of inefficient and low-value services. Therefore, to identify and guide in categorizing Class C activities, it is convenient to consider the 3 types of waste that are categorized and presented in table 214.
Table 2. Types of waste for activities: working for nothing (Class C)
| Administrative waste | Operational waste | Clinical waste |
|---|---|---|
| Any administrative expenditure exceeding what is necessary to achieve the overall objectives of the organization or the system as a whole. Administrative waste is the excessive administrative expenses primarily derived from the complexity of provider payment and insurance systems. | Administrative and operational waste are components of inefficient production. This refers to other aspects of inefficient production processes or activities in health care. It includes 4 subcomponents: duplication of services or activities, inefficient or non-value-adding activities, expensive inputs, and errors. | Waste created by the production of low-value products. Clinical waste is a form of allocative waste that has no value to the patient. Several factors in the health care system contribute to clinical waste. Waste can result from uncertainty in the science of medicine, where the diagnosis is unknown and each clinical interaction can lead to different care decisions. This can lead to “slow treatment,” the provision of health care services that, although beneficial to some patients, are of little or no value to others. Waste derived from specific medical treatments and procedures cannot simply be reduced to their direct medical costs, because any episode must be considered in its entirety. |
| Examples depending on the type of hospital | ||
| Billing for goods and services, insurance products and benefits, activities for regulatory compliance and accreditations, among others. | Duplication of activities or unnecessary reprocessing for validation that does not add value to the delivery of the product or service. Using overly expensive inputs, whether materials, personnel, or equipment. Errors, failures, or quality inconsistencies in production or service provided. For example, excessive use of diagnostic tests may be due to operational inefficiencies such as lost health records or the clinically inefficient use of these tests. | For example, asthma programs can improve health and lead to fewer “preventable” hospitalizations, but potential savings are reduced by costs to the system. Another example is basic medicines that were not used annually. |
|
Source: Adapted from Zeithaml13. |
||
Rework, failures, errors, and inconsistencies
Well-designed health care processes lead to higher quality products and services and less waste (lack of resource utilization), rework (work done due to not having performed the activity or task correctly the 1st time; this also includes continuous changes made and duplicated work between people), failures (components), errors (people), and inconsistencies (lack of stability and coherence, doing something one way today and another way tomorrow) that meet customer needs and expectations and specifically generate advantages, such as results with a marked reduction and elimination of activities that do not add value to real work (waste activities or lack of resource utilization). Furthermore, it increases the quality and efficacy of health care organizations by defining the sequence and interaction of activities in an orderly manner. Finally, it optimizes human, material, financial, and technological resources necessary for obtaining goods and services in medical care and increases the profitability or return on budget.
Creation and redesign of process maps
These are graphic representations of the sequence of activities that make up a process. They consist of describing movement or flow (which occurs over time) by various actors or process owners from different disciplines of knowledge, and using words to describe what each actor does with symbols or drawings made on a paper or electronic sheet15. The interdisciplinary diagram is subcategorized into 3 parts: external entities. This is the space for linking entities, whether client-provider, such as units, departments, or organizations external to the process or sub-process; processes. This corresponds to noting the various actors or process owners who participate internally in the performance of synchronized activities categorized as Class A, B, and C. Information technology. Specifying which activities are automated with information technology; symbology for process mapping. Specifies the homogenization of symbology for its design, understanding of the processes, and interpretation of the activities that are developed to provide the output of the good or service; elaboration and narrative of the list of process activities.
Process improvement and redesign
The continuous improvement of a model in processes is based on the Deming cycle16, a model that shows a series of actions aimed at planning, doing or executing activities, and checking and acting to regulate planned actions through management or direction and control indicators aimed at satisfying the requirements of the strategic plan with the monitoring of various activities in the processes17. It, therefore, becomes necessary to design and establish administrative and operational management indicators that guarantee objective and constant information through timely measurement, in a precise, objective, and extensive manner, regarding aspects of efficacy, efficiency, productivity, quality, or any incident presented by the priority activities identified in the mapping of the HSH’s processes. It is then that the PA also serves to analyze where in the process improvements can be made and indicators established. And where there are bottlenecks (activities or tasks that slow down the flow of other activities in the process), indicators are established to measure the optimal execution of the process. Therefore, it can be concluded that identifying and measuring byproducts, waste, errors, and inconsistencies is very useful with the use of process mapping within the organizational architecture of hospitals, and with this, visualizing activities, so that their causes are clarified, process objectives are aligned, and possible regulatory reforms or public policies for medical care are specified, which is necessary to improve the insurance market and social medical care and generate incentives for efficiency, and therefore, waste and byproducts in medical care will decrease and be eliminated.
Improving activities is a strategy in the process and is achieved through highly feasible and implementable actions (executing the process) and high expected benefit, through products, services, or deliverables of the process as a value and change proposal. This is obtained by following up on diagnoses with a work plan, actions, and training for the owners and actors who perform them, and by visualizing the maps of how the improved process turned out with its established process cycle times, with the delivery of improved and redesigned operation and procedure manuals.
In improvement, it is important to consider cycle times, where quantifiable goals will be set over a period of time to progressively decrease them. Therefore, within improvement, 2 types of process cycle times are distinguished18:
- – Activity cycle time (ACT): the total time required for the process from receiving a trigger until the process is completed.
- – Value-added time: the time required for value-added activities for the customer, that is, the time required for Class A activities that add value to the customer.
- – Mean cycle time (MCT): the mean time required from receiving a process trigger until the process stage is completed.
Redesigning activities is achieved through the analysis of each activity and identifying those of priority, value to the customer, and to the hospital. Redesign eliminates all activities that do not add value to the hospital, where there is rework, failures, errors, or inconsistencies; in addition, it distributes workloads across different positions and collaborators. Therefore, the process is redesigned, leaving activities that add value to the customer and the hospital. Through the development and integration of the map, a clear analysis of each activity is obtained that identifies: class A activities, which are customer-value activities; class B activities, which are administrative management activities; class C activities, which correspond to activities that are not important for the customer or the hospital, therefore, they will be considered unnecessary and the process map must be eliminated and redesigned.
Thus, it is in the redesign where the maps are restructured and activities that do not add value for either the client or the hospital, Class C activities, are eliminated. The redesign concludes by finding new ways to carry out stages that add value to improve process performance (Class A activities). At this stage, Class A or value-added activities for the client17 and Class B18 for the hospital can be located and identified. Moreover, higher priority activities (in red) of the process that if due to any failure, error or inconsistency there is process variability, it can become a bottleneck19.
Results
We obtained the architecture of level 2 and 3 emergency processes as a final product of the improvement and redesign of the emergency medical service sub-processes in 3 HSHs from Mexico City (Mexico). This was the result of the active participation of their medical, specialist, and nursing staff through interviews using the 8 questions outlined in the method to question the process actors and owners on-site. The improvements and redesign were validated by Emergency Chiefs and Medical Directors of the 3 hospitals for the improvement and redesign of their cross-functional processes, with the estimation of cycle times for each activity and a MCT of 8 h per shift for the third-level mapping and the establishment of KPIs in the priority activities (in red) of the cross-functional modeling. The cross-functional modeling at level 3 is presented with the validation of its maps of the stages that constitute the emergency service.
Figure 3 illustrates the timely treatment stage validated with the redesigned map having only 10 Class A, or patient value-added, activities with a MCT of 8 hours per medical care shift. The process begins with a trigger (request or requirement for patient medical care), followed by numbered and performed activities by the actors, with the priority activity belonging to the area head, an emergency specialist (activities 8A, 9A, and 10A). Here, it is verified that resident actors are providing the correct medical diagnosis in full compliance with applicable Mexican health record standards, and that a meeting is held with area staff and medical experts for patient medical care. The medical director is informed and kept updated on expected results and patients to be hospitalized; moreover, automation is shown in yellow on the personal computer (PC). KPIs should be established within the process for the activity in red to ensure medical care, in addition to existing outpatient survey indicators.
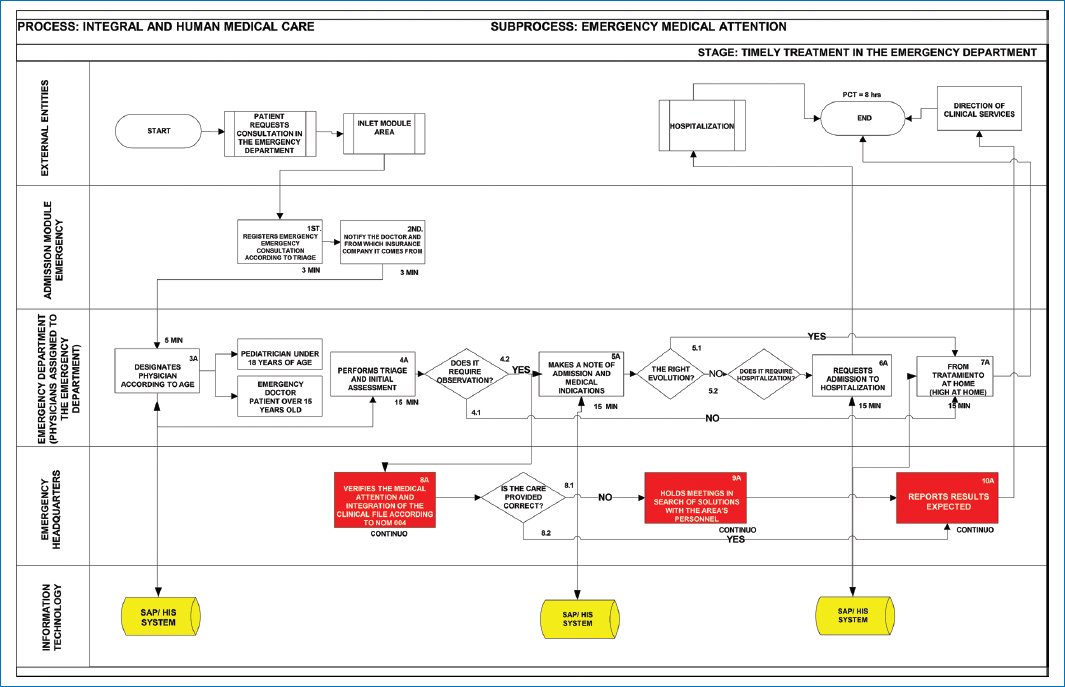
Figure 3. Redesigned and improved timely treatment map. This figure identifies the numbered sequential activities, with the average time of each Class A and B activity. The MCT is estimated at the end of the cross-functional mapping. It is read from top to bottom and left to right. The map is subdivided into: External entities: this section links, annotates, and interrelates entities, whether client-provider, such as Units, Departments, or organizations external to the process or subprocess; Processes: this section annotates the actors or process owners who participate internally in the performance of activities in the process or subprocess until the product or service is obtained; Information technology: this section specifies which activities are in automated systems or databases. Source: Adapted from Microsoft Visio15.
Figure 4 illustrates the study management stage validated with the redesigned map yielding 10 Class A, or patient value-added, activities with an MCT of 8 h per medical care shift. The process begins with a trigger (request or requirement for patient medical care), and then sequential, numbered activities performed by the actors are triggered, with the priority activity belonging to the residents (activities 1A, 2A, 5A, 6A, and 7A). Here, resident actors perform clinical assessment and request studies to support their correct diagnosis. Furthermore, automation is shown in yellow on the PC. KPIs should be established for activity 2A (performs study request depending on diagnosis) to measure time and ensure emergency medical care, in addition to the real or perceived emergency indicators estimated in some HSHs.
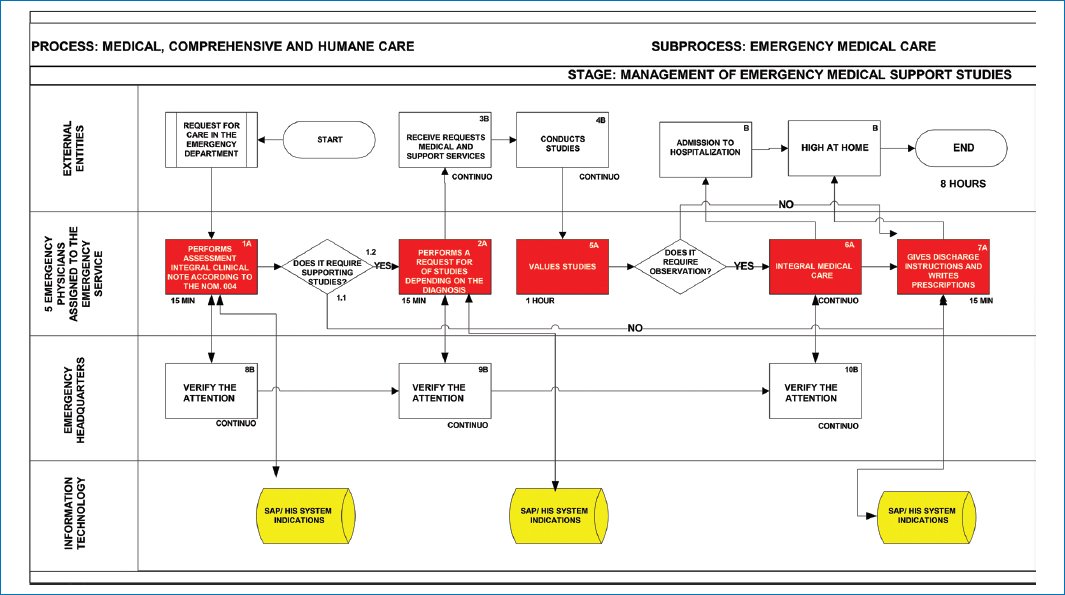
Figure 4. Redesigned and improved study management map. This figure illustrates the redesigned map for the study management stage. Source: Adapted from Microsoft Visio15.
Figure 5 illustrates the procedures stage validated with the redesigned map, containing 13 Class A, or patient value-added, activities and Class B, or HSH value (related to management) activities, with an MCT of 8 h per shift. The process begins with a trigger (request or requirement for patient medical care), and then numbered activities performed by the actors are triggered, with the priority activity belonging to the leading attending physicians, prioritizing medical care activities 2A, 3A, 7A, 10A, and 11A.
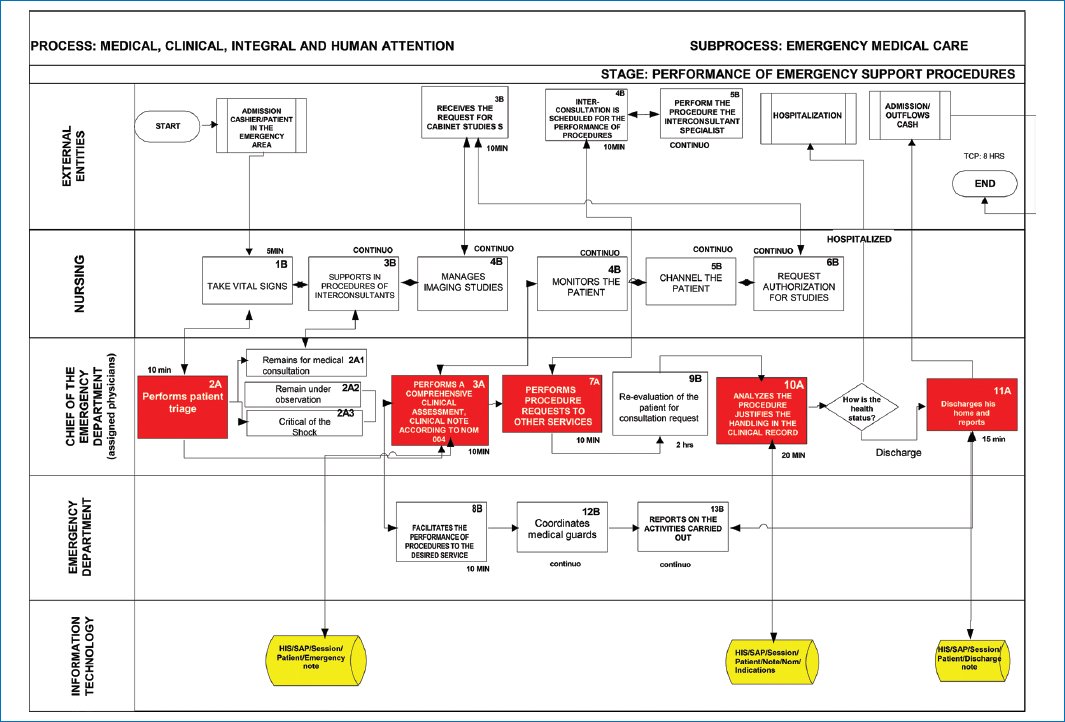
Figure 5. Redesigned and improved the procedure performance map. This figure shows the redesigned map for the procedures stage. Source: Adapted from Microsoft Visio15.
Figure 6 illustrates the validation result of the interconsultation process stage obtained with the redesigned map, showing only 11 Class A and B, or patient value-added and HSH value, activities with an MCT of 8 h per medical care shift. Here, attending residents are responsible for clinical assessment and requesting interconsultations according to activities 1A, 2A, 5A, 6A, and 7A to support their correct diagnosis. KPIs should be established for activity 2A (performs interconsultation request depending on diagnosis) to measure the time it takes for the requested specialist to arrive.
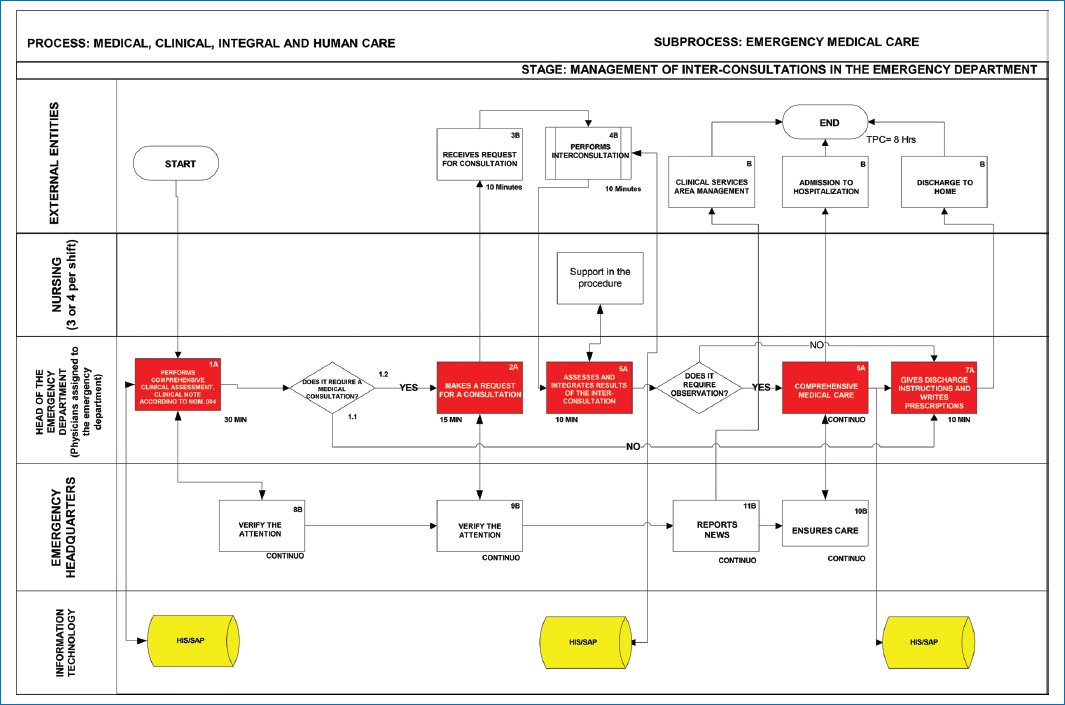
Figure 6. Redesigned and improved the interconsultation management map. This figure illustrates the redesigned map for the interconsultation stage. Source: Adapted from Microsoft Visio15.
Discussion
Excessive waiting times in EDs at HSHs are a trend; the actual mean time from patient entry to the ED until the medical visit was 38.3 min20. This provided an opportunity to prioritize diagnosis to redesign the predominance of Class A, B, and C activities within the process, and with the visualization of maps required in emergency analysis, to reduce the ACT of the main activity stages in emergency care. Furthermore, it addresses the implications for process improvement and reducing this waste of time and resources; challenges, such as high investment or budget costs, unwanted administrative complexities, and trade-offs among the interests of patients, payers, and providers.
It is essential to implement disruptive and useful cross-functional mapping knowledge to visualize efficiency, clarify its causes, align process objectives, standardize criteria, and eliminate waste and byproducts in medical care.
The line of future research remains open to add more priority processes, such as the reconversion of emergency services in contingencies through process mapping, and prepare HSHs for many other needs.
Conclusion
Hypothesis number 1 is accepted, as it is evident that Class C waste activities were eliminated in the cross-functional level maps, and activities were improved with mappings solely with Class A and B activities. Hypothesis number 2 is accepted as well, as cross-functional mapping allows for placing KPIs. Therefore, although it is noted that exit surveys are applied at the end of the emergency medical care process, it is confirmed in the maps that KPIs also need to be measured and validated in red or priority activities. With the above, it is concluded that the PA implements the strategy of cross-functional processes (in no more than 6 months) for efficiency within EDs, which is essential given the growing demand for medical care in HSHs. It is the means to analyze where in the process activities can be redesigned by analyzing each activity in the maps and identifying those of priority value to the client and the organization; redesign eliminates all Class C activities. The improvement and establishment of indicators is applied where there are bottlenecks that slow the activity cycle time (ACT) and the optimal performance of the process, it’s a valuable strategy for execution of the process. Part where bottlenecks prevent the minimum MCT and value of the process and ensure the optimal execution of the process: improving activities is a strategy in the process through valuable initiatives for its implementation for the delivery of service in emergency medical care. It is a diagnostic contribution to its PA along with a working plan, actions, and training for the owners and actors who carry it out; also, by visualizing the maps of how the improved process turned out with its established process cycle times, with the delivery of manuals and accessible to all staff for consultation on improved (automated) and redesigned operations and procedures, will surely contribute to success in emergency medical care.
Acknowledgments
The authors would like to thank the Sistema Nacional de Investigadores and the Unidad Profesional Interdisciplinaria de Ingeniería y Ciencias Sociales y Administrativas of Instituto Politécnico Nacional for their facilities for the present investigation.
Funding
The authors declare that this research received a post-doctoral fellowship from Secretaría de Ciencia, Humanidades, Tecnología e Innovación (SECIHTI).
Conflicts of interests
The authors declare no conflicts of interest.
