Introduction
One of the fundamental objectives of science is to generate truthful, reliable, and reproducible knowledge using validated measurement instruments previously applied to carefully selected subjects and study objects based on inclusion, exclusion, and elimination criteria. From these, databases are formed, which are used for qualitative and quantitative analysis of study variables using elective and selective mathematical and statistical tools based on the distribution and characteristics of the data. The objective of this work is to discuss the feasibility and objectivity of using linear tools in measuring biological phenomena over time. To this end, various nonlinear aspects that can be applied in the analysis of medical, paramedical, and biological disciplines, among others, are discussed and presented.
Linearity
In the field of medicine, statistical tests are indiscriminately used to determine whether there is a linear correlation between the obtained data. Karl Pearson, in 1920, published the existence of positive and negative correlations1 based on the studies of Francis Galton published in 18882. He defined the positive and negative value of the correlation based on the slope’s inclination, that is, whether it was > or < 90°. Regardless of scatter plots and the linear regression model, it can be said that Galton and Pearson laid the foundations of knowledge in this field. It is worth noting that linearity was the basis of Newton’s third law: “for every action, there is an equal and opposite reaction,” that is, a cause for an effect.
Back in 1900, the world population was 1.5 billion people, and by 2022, it reached 8 billion. Currently, globalization and the ease of mobility between countries and continents facilitate the transmission of diseases, exponentially increasing the speed of contagion among all inhabitants of the planet, as seen in the pandemics that have occurred, including the most recent one caused by the coronavirus disease 2019 (COVID-19), generated by the severe acute respiratory syndrome coronavirus 2 (SARS-CoV-2). Based on this, it is important to question whether the mathematical models generated 136 years ago still have the same application and certainty today, especially in the face of biological phenomena that we know are cyclical and nonlinear.
Dynamic systems and chaos theory
Currently, we are certain that in biological phenomena and medicine, there is no cause-effect relationship as established by Newton’s third law. Instead, there are many causes for a single effect. One of the important concepts in dynamic systems is that “small changes in the initial conditions of the system can generate large changes in the final outcome.” Thus, in the superficial forms of their evolution, they may take different routes, such as self-organization, synchronization, unpredictability of the effects of small changes in initial conditions, as well as the existence of simplicity at some levels while chaos exists in other forms, according to the fundamental concepts of complexity3. Various spatiotemporal properties in complex systems arise spontaneously from the interactions within the system in question, which have a longitudinal impact over time, generating unexpected properties or effects in any given system. These properties have been termed “emergent processes,” and in this way, we can know the beginning of a system or process. However, it is impossible to determine how this system will behave over time, a problem faced daily by health care personnel when making future prognoses. Arch-Tirado et al. (2009) described the utility of complexity and chaos sciences in the analysis of zoonoses, discussing the difficulty of knowing all the independent variables (causes) that generate the dependent variable (effect), demonstrating that linear approaches are entirely ineffective when studying and analyzing such phenomena4. From this publication, we can understand the uncertainty experienced recently during the COVID-19 pandemic.
Normal distribution
Karl Friedrich Gauss (1777-1855) was a German astronomer and mathematician. His ideas on the study of the characteristics of curved surfaces, detailed in his work Disquisitiones generales circa superficies curvas (1828), laid the foundations of modern differential geometry5. He is considered the pioneer in conceptualizing the “Gaussian bell curve,” also known as the normal distribution, which describes the behavior of data distribution based on the mean and standard deviation, located at the highest point of the curve or the meeting point of the mean, median, and mode (which in theory should have the same value), hence the name “measures of central tendency.” We must remember that this distribution is found in very large populations (N). For example, if we were to evaluate neuromotor capacity based on displacement in the Mexican population, we would likely find a normal distribution, where, regardless of the evaluation performed, the skills assessed over time would show an ascending and descending trend. Thus, time plays a fundamental role in measurements over time, space, and the resulting curve.
The arrow of time
What is time? Starting from the formula for velocity,  , we have
  . We say that time is a displacement at a given velocity. Let us not forget that all biological phenomena operate under this premise. Currently, physicists and astrophysicists have incorporated the term “arrow of time” to refer to this displacement, highlighting, among other reflections, that “the past always remains out of our reach, that is, we cannot stop or reverse the flow of minutes and hours, as it is possible to retrace the path we take in space; the future only takes shape vaguely based on clues and conjectures”6. We must consider that the effects of today are a consequence of the Big Bang (the origin of the universe), that is, an immeasurable number of causes that lead us to the current effect. Based on this, if some of our ancestors, for example, our great-great-grandmother, had not been in a specific time and space, we would not be here. Therefore, we can question whether we exist by chance or causality, just like all biological phenomena, since their existence is the result of a long and immeasurable chain of prior events. The manipulation of causes to achieve a specific effect in any given time and space is the basis of experimentation. Over time, this manipulation is entirely random, so the effects of today are entirely unpredictable. In this way, being subject to the arrow of time, we live in a completely unpredictable world.
Criterion of the first and second derivative in measurements over time
Arch-Tirado et al. (2019) demonstrated the utility of the first and second derivatives in dynamic measurements of critically ill patients based on the scores obtained from the APACHE II scale. It is shown that over time, based on the clinical interventions performed on these patients, changes in scores can be observed in minutes and hours, such that using conventional measurements would introduce biases in the results obtained. By using the criteria of derivatives, recalling that the first provides instantaneous velocity and the second acceleration, it is possible to establish that measurements in dynamic systems must be performed using mathematical models specialized in dynamic systems over time7.
Health-disease process and spatiotemporal uncertainty
Arch-Tirado et al. (2020) discuss the complexity of taking simultaneous measurements in the field of public health and associate this complexity with the principles of quantum mechanics, that is, “the velocity of an electron can be predicted, but not its position, and vice versa.” In this way, when measuring the dynamics of transmission of highly contagious diseases, such as COVID-19, the origin of the contagion and/or transmission can be determined, but not the speed of spread. They also discuss that an individual cannot manifest the same signs and symptoms as others, based on the large number of variables involved, since two humans cannot occupy the same place in space at the same time8.
Probabilistic 3D measurement system, arrow of time, and 4D
Arch-Tirado et al. (2022), based on the World Health Organization (WHO) definition of health as “a state of complete physical, mental, and social well-being and not merely the absence of disease or infirmity”9, propose a simultaneous probabilistic measurement system, taking biological, psychological, and socioeconomic factors as axes in a unit probabilistic cube, demonstrating the probabilistic intersections A ∩ B ∩ C in a specific time and space within a study sample. They conclude that multivariable measurements should be performed to avoid biases in data collection and interpretation10. Of note, the results obtained show the possibility of performing simultaneous measurements at the time of data collection. However, if measurements were taken in the same sample with the same measurement instrument over time, changes would be observed based on the effects generated by the temporal environment on each of the axes, that is, the same measurements would not be obtained over time in the same evaluated subjects. When analyzing a 3D system in the arrow of time, it becomes a “4D” analysis, meaning any 3D system in an arrow of time becomes 4D11.
The role of integral calculus in nonlinearity
The objective of linear correlation analysis is to establish the linear regression equation of the line f(x) = mx + b, where m is the slope of the line and b is the point where the slope crosses the y-axis. If, when performing a correlation analysis, the scatter plot, the calculation of the correlation coefficient r (value −1 ≤ r ≤ 1), and the equation of the line are not performed, it can be said that the calculation has not been fully completed. Similarly, it is necessary to establish the interval where the greatest correlation between the analyzed variables lies, using the mathematical symbolism of intervals [a;b], that is, the numbers between the values that bound the interval on the x-axis.
If we conceptualize that at each moment there is a specific space and time, and that linearity (cause-effect relationship) in biological phenomena does not exist, linear correlations in a specific time and space may be segments of one or multiple curves over time. Thus, based on the above, it is possible to establish the shape of the curve starting from quadratic or nth-degree equations, based on the number of curves existing along the causal chain in the arrow of time. That is, we can use integral calculus to establish the nonlinear behavior of the numerical model, starting from the formula:
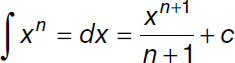
Integrating the equation of the line:
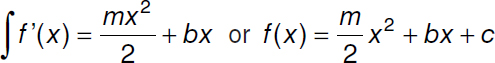
We obtain a quadratic equation and, therefore, when graphed, a curve or parabola.
Conclusions
Biological phenomena, from the origin of the universe (Big Bang) to the present moment, are the result of a long chain of causal and random events. Therefore, by not identifying and considering the large number of causes that generate a single effect, as established by the theory of dynamic processes and chaos, biases in the interpretation of results will arise.
Mathematical and statistical models that consider simultaneous multivariable probabilistic intersection measurements should be used.
It must be clear that measurements taken at a specific time and space are, so to speak, a value in a fragment of time, so previous or subsequent measurements will be entirely different from those already obtained.
Dynamic systems indicate that small changes in a system can generate immeasurable changes in it, as demonstrated by Lorenz in the “butterfly effect.”
With the above, it is suggested to be cautious with linear measurements and their interpretation, emphasizing that the results obtained are the result of the behavior of two variables in a specific time and space, bounding the results within mathematical intervals.
Personnel in biological, medical, and paramedical fields should use mathematical tools such as differential and integral calculus, among many others.
Funding
The authors declare that they have not received funding.
Conflicts of interest
The authors declare no conflicts of interest.
Ethical considerations
Protection of humans and animals. The authors declare that no experiments were conducted on humans or animals for this research.
Confidentiality, informed consent, and ethical approval. The study does not involve personal patient data and does not require ethical approval. The SAGER guidelines do not apply.
Statement on the use of artificial intelligence. The authors declare that no generative artificial intelligence was used in the writing of this manuscript.
